
On this page, we explain genetic diversity and why it matters, and describe the genetic diversity indicators included in the UN Convention on Biological Diversity’s Kunming-Montreal Global Biodiversity Framework (KMGBF, 2022).
Genetic diversity
Biodiversity doesn’t include just the diversity of different species, but also the diversity within each species. Different individuals of the same species vary in obvious traits – such as size or colour – and in less obvious ones such as resistance to heat or disease. Many of these differences are underpinned by genetic differences. When we talk about monitoring and protecting genetic diversity, what we care about is this genetically based variation in nature.
Within-species genetic diversity can be found at two levels: individuals differ both within and between populations. For example, within a single population, some individuals might be slightly better at withstanding high temperatures than others. But there might also be differences between populations, e.g. with genetic variants for withstanding high temperatures being more common in populations in warmer climates.
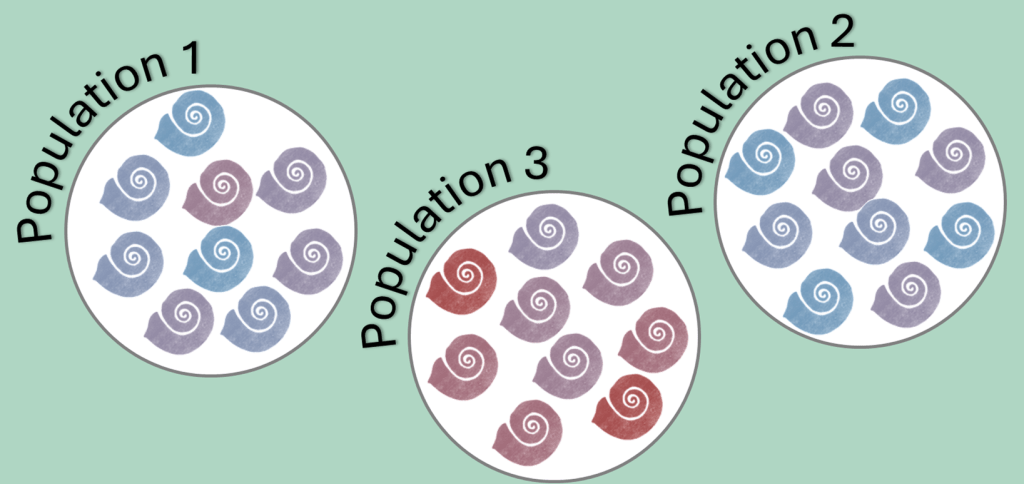
Genetic diversity exists within and between populations. Different colours indicate different genetically based adaptations, e.g. different levels of tolerance to heat (redder colours = higher heat tolerance).
Why genetic diversity needs protection
Genetic diversity is essential for species – both because it helps them survive in varied environments and because it allows them to adapt, over generations, when conditions change. Using the same example as above: If individuals within a species vary in their heat and cold tolerance, the species might be able to exist in a range of diverse habitats both on the small scale (e.g. different sides or elevations on a mountain) and on the large scale (e.g. different climates). When temperatures increase, a species with more diversity in temperature tolerance is more likely to contain at least some individuals that can handle the new conditions, and is more likely to persist and thrive.
However, investigations have shown a decline in genetic diversity in many species, globally. For species to survive in the long run and through human-caused challenges such as the climate crisis, we need to halt this genetic diversity loss.
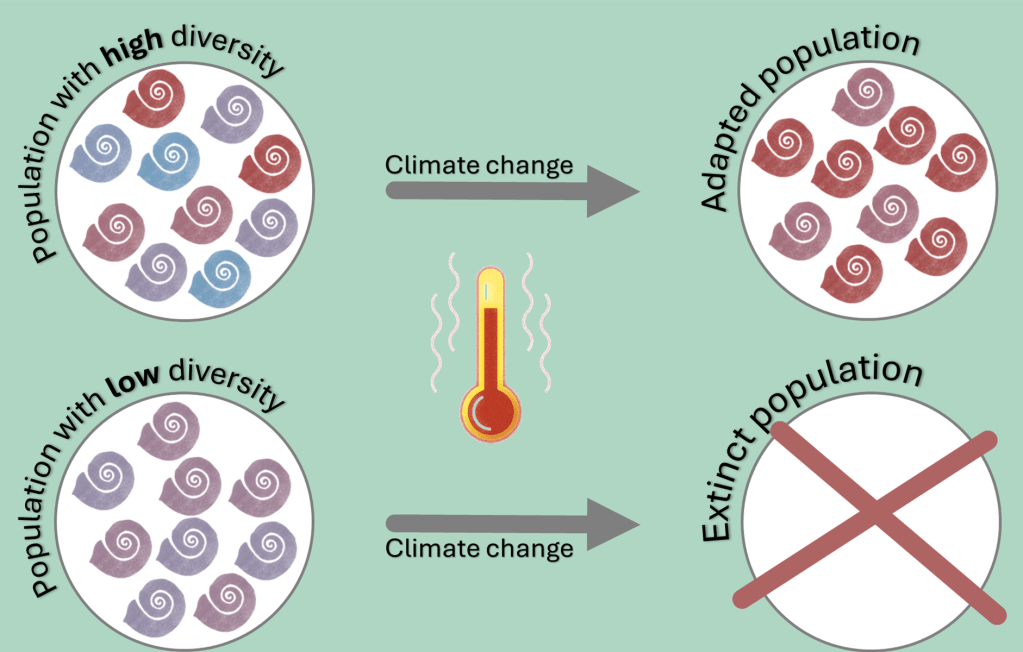
Populations with higher genetic diversity are more likely to contain useful variants when the environment changes. In populations with high genetic diversity, some individuals may be able to handle the new conditions and increase in the population over time (top; red individuals have higher heat tolerance). In contrast, populations with less genetic diversity are more likely to go extinct (bottom).
The genetic indicators
Genetic diversity indicators (for short, genetic indicators) are a tool to assess biodiversity. The goals are (1) to evaluate whether there is enough genetic diversity to deal with environmental changes, and (2) to monitor changes in genetic diversity over time. The insights gained via the indicators will then facilitate the conservation and restoration of genetic diversity.
The KMGBF recognizes the value of genetic biodiversity and acknowledges that biodiversity indicators used so far fail to cover genetic diversity (which is often not readily ‘visible’). It therefore includes, for the first time, two genetic indicators for wild species. All 196 member states need to report on these genetic indicators from 2026 onwards.
The indicators included in the framework were chosen to be easily applicable while still being informative. Because adaptation is complex and involves many genes (most of which are unknown), and detailed DNA-based studies are often costly and slow, indicators measuring functional genetic diversity directly are unrealistic. The chosen indicators instead rely on proxies and do not require DNA data. They use a simple principle: All else being equal, species have more genetic diversity and are less likely to lose genetic variation over time when
- they have large populations (specifically, larger than a known threshold of genetic diversity loss)
- more of their original populations are maintained.
Indicators based on these aspects are a useful and practical way to assess genetic diversity and to identify species and populations needing genetic interventions.
Within-population genetic diversity: The Ne 500 indicator (Headline Indicator A.4 of the KMGBF)
The Ne 500 indicator reflects whether populations are large enough to maintain genetic variation in the long term. It is defined as the proportion of populations within species with an effective population size > 500. Importantly, it does not use the census size (the number of mature individuals) but rather the effective population size (Ne) – a metric from population genetics that more directly reflects how much genetic variation a population loses over time. The reason for using Ne is that different populations with the same number of individuals might behave very differently genetically. For example, a population of 1,000 individuals where most individuals contribute a similar number of offspring to the next generation will maintain more genetic variation than a population of 1,000 individuals where only a small number of individuals reproduce (even if the total number of individuals remains the same in both populations). The effective population size takes such factors into account and is usually smaller than the census size.
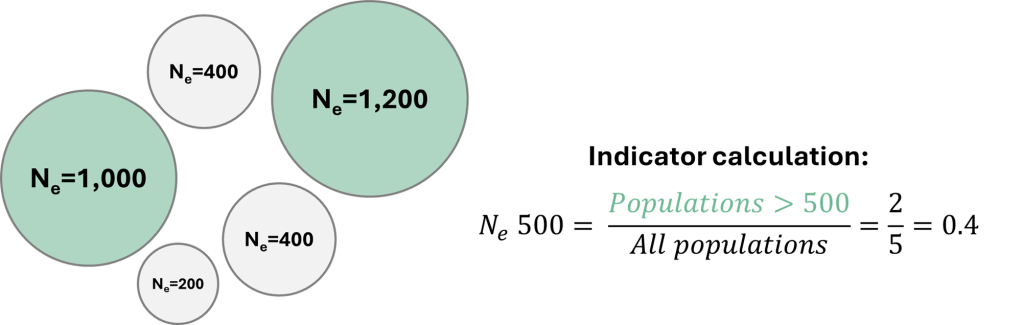
The Ne 500 indicator is the proportion of populations with an effective population size (Ne) greater than 500.
Why does the indicator use 500 as a threshold? The reason is that Ne 500 has been established by extensive research as a threshold below which the long-term maintenance of genetic diversity isn’t possible.
There are two general ways of quantifying Ne in practice. First, if DNA data are available (e.g. whole-genome sequencing or microsatellite data), Ne can be estimated with easy-to-use software. For example, when genomic data reveal that many individuals are closely related or that statistical associations among genes are common, Ne is likely to be small.
Second, Ne can be estimated without DNA data. Extensive research has found that Ne is about 10% of the census size in many different species – and this means that a rough estimate of Ne can be approximately obtained by dividing the count of mature individuals by 10. This method is less exact than those based on genetic data, but it can realistically be applied to large numbers of species. When a more precise ratio between Ne and the census size is known (as is the case e.g. for some bird species), this ratio should be used instead of the 10%.
Once Ne has been estimated for all (available) populations of a species, it is simple to calculate the Ne 500 indicator: It is just the number of populations with Ne > 500 divided by the total number of populations.
Between-population genetic diversity: The Populations Maintained indicator (Complementary Indicator of the KMGBF)
The Populations Maintained indicator is defined as the proportion of populations maintained within species, and therefore reflects the loss of population-specific genetic variation. Of course, the calculation of this indicator requires a baseline time period. According to the KMGBF, the default is the period 2010-2020, but the states can adjust this based on their needs and data availability.
Once the identity of all populations has been established, it is simple to calculate the Populations Maintained indicator: It is just the number of populations that still exist today divided by the total number of populations that used to exist.
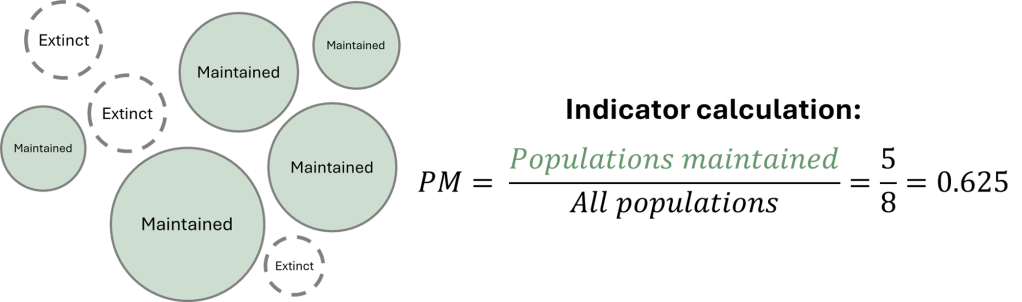
The Populations Maintained indicator is the proportion of populations that currently still exist (green). Extinct populations are indicated by dashed outlines.
Want to find out more?
More detailed information about genetic indicators and how to calculate them, developed in a previous research project, can be found here: Guideline materials and documentation for the Genetic Diversity Indicators of the monitoring framework for the Kunming-Montreal Global Biodiversity Framework.
The guidelines by the Convention on Biological Diversity on biodiversity monitoring in general are here (genetic indicators from page 70).
A high-level overview of advantages and challenges to the indicators, written for non-geneticists, can be found here.
A webinar explaining the indicators, hosted by the European Commission, is here (there are also several other relevant webinars on the same channel).
