
The Belgian experience
In February 2026, most states are required to report to the UN Convention on Biological Diversity (CBD). For the first time, this report needs to include indicators of genetic diversity in wild populations.
Wondering how to get started with the report, facing some challenges, or just trying to understand how genetic indicators work in practice? In this post, we take a look at the process – from gathering data to calculating indicators. We use Belgium as an example, where the report is underway with GINAMO involvement.
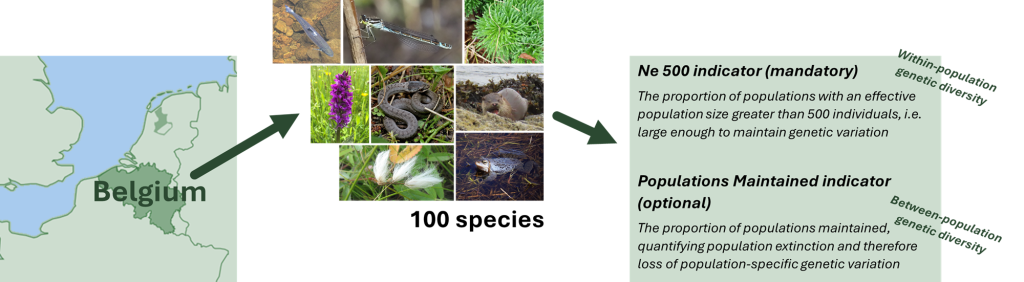
Simplified overview of the process in Belgium.
Joachim Mergeay is a researcher at INBO, the Belgian Research Institute for Nature and Forest, an associate professor at KU Leuven, and also a member of the GINAMO team. He is in charge of compiling the data and calculating the indicators for Belgium and has answered the questions for this post.
Background
How did you become involved in indicator calculation? Our institute, INBO, is already responsible for biodiversity monitoring and reporting for Flanders (the northern half of Belgium), so it was clear that it would take care of the genetic indicators as well. Within the institute, the question quickly came to me as I have been working on genetic indicators for years. We agreed with the colleagues in Wallonia (the southern half) to do the reporting jointly for the entire country.
How many people are involved in the process? We compile the data and calculate the indicators mainly with just two people, an MSc student and me. However, it wouldn’t be possible to assess a large number of species accurately without the input of different species experts we work closely with. The CBD reporting itself – putting everything in context and writing the reports – is done by another team here at the institute.
How long does it take you to assess one species? It depends… We often had really good primary data from species observation platforms, with census size data for quite some populations (especially plants). In those cases it was rather straightforward. We started by making a “fact sheet” for each species, containing useful information on abundances, densities, census sizes, connectivity – if possible for each population. We annotated the source data we got this information from. This helped a lot along the process, especially when we needed to revise information or consult experts. On average, a single species required half a day of work, but it varied a lot – for some species it took less than an hour, while for others we spent several days finding and improving our estimates over the course of a year.
Selecting species
How were the species chosen that will be included in the report? We focus on a list of priority species for conservation defined already much earlier by INBO, in the framework of policy relevant biodiversity monitoring. It includes species in Annexes II and IV of the European Habitats Directive, plus species of more regional conservation concern. This is obviously not an unbiased list, but at least it is something that policy is interested in. For the first reporting, the key is to get the procedures established.
How many species do you assess? For the CBD we are reporting on exactly 100 species (which is coincidentally a round number). The list we started out with included about 120 species, and we narrowed it down to 100 species where sufficient data are available and indicator calculation is possible.
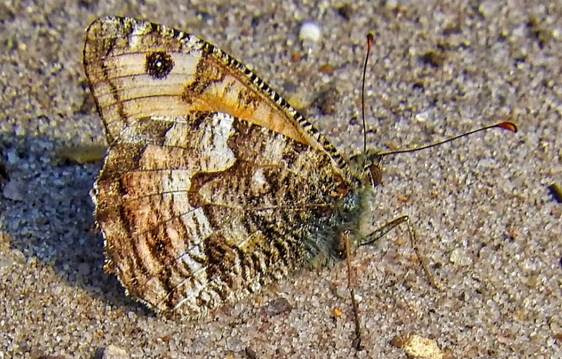
The grayling, a butterfly occurring particularly in coastal areas, is a high-priority species on the list defined by the Flemish government, and is extinct in Wallonia. It is therefore included in the indicator calculation and reporting.
Compiling data
What kind of data do you mostly use? We have access to a very good database of species occurrence records in Belgium, run by an NGO, Natuurpunt. Similar databases exist in many other countries. From this database, we know where the species occurs and can plot this information on maps. For a subset of species – such as some orchids, which are very well studied – we also have accurate estimates of census sizes (counts of flowering individuals) for each population. Actual DNA data were only available for a small number of species, but luckily DNA data are not required to calculate the genetic indicators.
How do you compile the data in practice? We enter the data into an online form, developed for a pilot study on genetic indicator assessment (Kobo form; you can get your own copy here). This is a data registration tool where all the relevant information for each population can be collected in a standardised way. It produces a simple spreadsheet, which can then be used for indicator calculation. This has made the process much easier for us. Aside from that, we have the fact sheet mentioned above for each species.
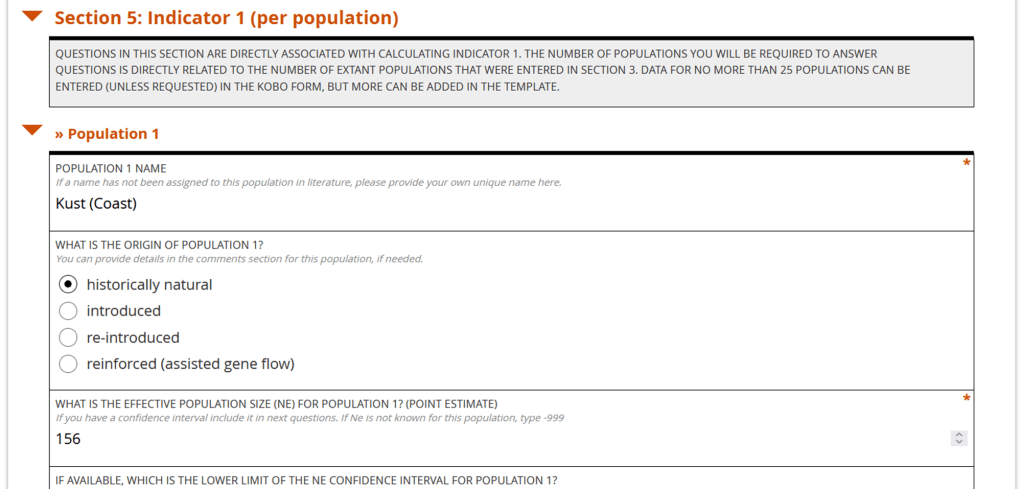
The Kobo form is a convenient tool for recording the data for each population and keeping track of the methods used.
Delimiting populations
Both genetic indicators require assessment at the population level. The data you use, e.g. occurrence records, often do not directly contain population information. How do you delineate populations? Typically, we first look up the dispersal distance of the species and add a “buffer” with a radius equalling this distance to each occurrence record on the map (see example for the grayling below). If the dispersal buffers of different records clearly overlap, we group them into the same population, as there is likely enough gene flow between them. If buffers do not overlap, we might be dealing with separate populations. Sometimes this approach generates clear results; for example, in the grayling butterfly, we clearly have two separate populations. Of course, when using this approach, one needs to consider whether gaps between occurrences could also be due to sampling gaps.
What do you do about cases that are less clear? Knowledge about the species ecology and dispersal barriers, and especially the input of the species experts has been crucial. For example, for another butterfly species, we found two individuals close together and far from any other population, and assumed they represented a separate population. But when I talked to the expert, he said, “There is no population there – there has never been reproduction in that area, and these individuals should be removed from the assessment.”
Were there also species where you had to give up? Yes, there are species where we honestly have no clue. For example, in the bicolored shrew (Crocidura leucodon), we had only 67 observations spread across all of Belgium and no genetic data, so we could not define population boundaries or estimate population sizes. We will just not include that species in the national report.
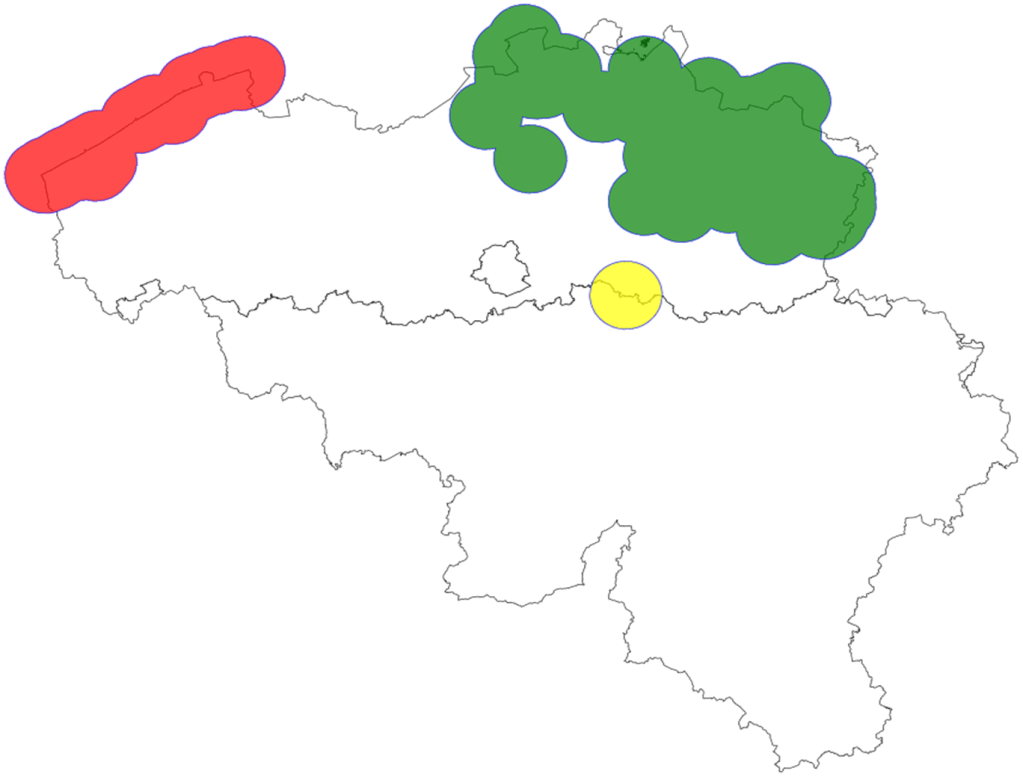
Distribution and population delineation of the grayling butterfly in Belgium. Each circle is centred on an occurrence record; its radius is the dispersal distance of the grayling. In this example, there is clearly a western (coastal, red) and an eastern (green) population that likely do not mix much. The yellow circle reflects a single individual found unusually far from the two populations, probably a rare long-distance disperser, which was not treated as a separate population.
Estimating effective population size and calculating genetic indicators
Once you have the data for each population, how do you go about the indicator calculation? We apply our own scripts to the spreadsheet output by the Kobo form. We decided to calculate both the mandatory Ne 500 indicator (See figure below) and the optional Populations Maintained indicators. For the latter, our reference is the period up to the 1950s – i.e., we report the proportion of populations that have been maintained since then. The PM indicator can be difficult to interpret when populations split or merge, so for correct interpretation it is important to store as much information about the population histories as possible.
For calculating the Ne 500 indicator, you need an idea about the effective population size (Ne) for each population. How do you obtain this from your data? It is well established that in the majority of species, Ne is roughly 10% of the count of mature individuals in the population (Nc). This means that a population needs Nc > 5,000 to have Ne > 500. For species where we have count data, we can simply calculate Ne using this relationship. When we do not have count data, but we know the area a population occupies – based on the occurrence records – we can just check whether this area is large enough to maintain 5,000 individuals. For example, for several amphibians such as tree frogs and moor frogs, we know that 5,000 individuals require about 250 hectares. So if the area occupied by a population is larger than 250 hectares, this population likely has Nc > 5,000 and Ne > 500. We always consult experts to verify our “guesstimates”.
How do you use DNA data? When good DNA data are available, we can estimate Ne directly, using for example the Linkage Disequilibrium method. Importantly, this is also an opportunity to check the results obtained with non-DNA data. For example, in the moor frog, we used occurrence records from citizen science to estimate Ne based on the occupied area, as I explained before, and we independently estimated Ne with genetic data. The results of both approaches were strongly correlated, suggesting that non-genetic data work well for this species. In the grayling, DNA data really helped to establish that we indeed have two distinct populations, and it confirmed that one population had Ne < 500. Because there are not enough resources to study many species with DNA data regularly, ideally, one would rotate DNA studies between species. The aim would be to do a comparison between DNA-based and non-DNA results for as many species as possible in the long term.

Extract from the spreadsheet output by the Kobo form for the grayling. This species has two populations, one of which has an estimated Ne > 500. The Ne 500 indicator for this species is therefore 0.5.
Dealing with challenges
How do you deal with populations that are not entirely located within Belgium? The unit that matters for the species is the population. We therefore need to assess transboundary populations across their whole area, not just in Belgium. We did this for some species, including the grey wolf. However, we deliberately excluded birds from the Belgian assessment because many of them have large dispersal distances and transboundary populations that we cannot assess with the Belgian data we rely on for this report. We instead look at birds on the European scale in a separate project.
Are there any challenges specific to Belgium? Yes, Belgium is divided into regions with different institutions responsible for calculating genetic indicators. Instead of working separately on our own ‘pet species’ and then amalgamating the results for Flanders, Wallonia and the Brussels Capital region, we wanted to grab the opportunity to start a close collaboration. We aimed to jointly select species through a participative process with various stakeholders from both regions, and deliver a joint high quality report from the very beginning. We had a GINAMO workshop earlier this year to get this kickstarted, but for the 2026 report this was too late. Although this participative process can be a bit cumbersome, it is absolutely needed to have a good representation of all regions. We hope the next report will have a more balanced representation of species.
If you had to give one piece of advice to other stakeholders involved in the calculation and reporting on genetic indicators, what would it be? Get started and get experience in doing these assessments. Don’t be afraid to be wrong – just try, and reach out to specialists in your country!
