
We have collected a range of questions about genetic indicators and their application from the literature and our discussions with stakeholders. Scroll through them below, or click on the topic you’d like to read about here:


Background and concept
Why do we need genetic diversity indicators?
Biodiversity indicators are measurable variables that summarise information about the state of biodiversity. Genetic indicators do this for genetic variation. They enable straightforward reporting as well as monitoring of genetic diversity and species’ genetic risk, enable scientists, policy makers and the public to understand trends, and can help design management action.
While there are many genetic diversity indicators, we focus on two of the Global Biodiversity Framework indicators here, the “Ne 500 indicator”, the headline indicator A.4, and the “Populations Maintained” indicator, which is the complementary indicator A.CY.22. In the Global Biodiversity Framework the Ne 500 indicator is defined as “the proportion of populations within species with an effective population size (Ne)>500”. Ne reflects the rate at which genetic diversity is lost. Ne is typically much smaller than the census size (Nc) because several demographic processes affect the genetic contribution to the next generation (such as sex ratio, non-ideal offspring contribution, etc). The smaller Ne, the more genetic diversity is lost over time. If Ne is larger than 500, hence >500, adaptation to environmental changes likely remains possible. This indicator is therefore a standardised measure of the proportion of “genetically safe” populations.
The “Populations Maintained” indicator is the “proportion of populations maintained within species” and is therefore a standardised measure of the maintenance of between-population genetic diversity. More information about the indicators can be found here and here.
Each indicator can be calculated for a single species, but the Convention on Biological diversity (CBD) requires reporting of a single value per country for each indicator – i.e., the country level indicator is an average of the Ne 500 indicator across all assessed species. However, to facilitate management and species conservation action, it is useful to make the results of both genetic indicators publicly available on the level of species and taxonomic group (e.g. plants, vertebrates, invertebrates). A “disaggregated” value per taxonomic group can be reported through the CBD reporting template.
More information: Hoban et al 2020
Why use a threshold of Ne=500?
Thresholds are a common practice in environmental decision-making, e.g. for the Red List or climate change policies. They provide a framework for comparison and facilitate clear decisions about whether action is needed. The Ne=500 threshold is based on extensive research showing that lower Ne values threaten the capacity to adapt to environmental change. While estimating Ne accurately can be challenging, practitioners or researchers can often reliably say whether a population is above or below this threshold, enabling robust reporting.
Nevertheless, while the threshold of 500 is generally suitable, there might be a few exceptions – e.g. species that evolved on small islands or have adapted to small population sizes. The GINAMO project will develop guidance for applying Ne in such situations, so keep in touch!
More information: Hoban et al 2023
What is meant by “proxy data” and why is it useful when calculating the Ne 500 indicator?
A proxy is a substitute, used to replace something that is difficult or impossible to measure directly. In the context of the Ne 500 indicator, “proxy data” refers to non-DNA data (e.g. counts of individuals) used in place of DNA data to obtain Ne.
Proxy data is definitely useful! Compilation of information across a large number of species and taxonomic groups has established that for more than 60% of them, Ne is about 1/10th of the census population size (Nc, the number of mature individuals). Thus, Nc data is usually sufficient to roughly calculate Ne – i.e., it is adequate proxy data. Nc data in its simplest form is just a count or even rough estimate of mature individuals, but it can also be obtained from other non-genetic approaches. In contrast to expensive and time-consuming DNA analyses, Nc data is already available for numerous species, can deliver results within hours via desk study or consulting experts, and can leverage existing monitoring programs and expertise.
DNA is often seen as the “gold standard”, and using Nc as a replacement is not perfect – e.g., for some species the assumption that Ne/Nc≈0.1 might not be correct. However, the resulting imprecisions are outweighed by the advantage that Nc enables rapid indicator estimation for a large number of species. This efficiency is crucial for making timely conservation decisions.
More information: Coalition for Conservation Genetics guideline materials, Hoban et al 2024a, Hoban et al 2024b
How are the indicators useful for populations that have declined so much that it seems impossible to reach Ne>500 again?
Including such populations is very relevant when assessing the status of genetic diversity in a country. Even when it is unlikely that Ne 500 will be reached, it is crucial to flag such populations, as conservation efforts might still be beneficial. In such populations it is especially important to keep track of the actual Ne estimates, even when they are not included in the CBD report.
More information: Hoban et al. 2024
Isn’t the Ne 500 indicator misleading for populations that “naturally” don’t have Ne>500?
For a small minority of populations, e.g. populations on islands or endemics with a small natural distribution range, it is true that Ne below 500 is not a cause for concern. Such exceptions are unavoidable when working with simple indicators meant to be applied to a vast range of species. It is still relevant to monitor Ne in such populations, and taxon-specific research can establish an appropriate minimum Ne.
More information: Hoban et al. 2024
Does it really make sense to divert resources from the species and ecosystem level to monitor genetic diversity?
Yes! Biodiversity at the species and ecosystem level can only persist in the long term if sufficient genetic variation is available at the within-species level. Monitoring genetic diversity is necessary so that diversity loss doesn’t go unnoticed and conservation and management decisions can be made in time to avoid negative effects at higher levels of biodiversity. Moreover, the possibility to use proxy (non-DNA) data limits the time and funds required for indicator-based genetic monitoring. Lastly, DNA-based or proxy-based monitoring can be coordinated with species and ecosystem monitoring (using shared personnel, equipment, field expeditions, etc.) to save resources.
More information: Hoban et al. 2024
Why are the indicators relevant when what matters for population persistence is adaptive genetic diversity?
The indicators function as proxies for adaptive genetic diversity – all else being equal, larger populations and species with more populations contain more adaptive genetic diversity. The correlation between Ne and adaptive genetic diversity is not perfect, but it is sufficient for the Ne 500 indicator to be informative. Of course, it can be very valuable to assess adaptive diversity more directly in important species, but this approach is challenging and cannot be applied on a large scale.
More information: Willi et al. 2022, Hoban et al. 2024
Isn’t it an oversimplification to assess genetic diversity without DNA data?
It is true that in many cases, DNA-based data might generate more accurate results (assuming sufficient sampling, appropriate analyses, and careful interpretation). However, even with DNA data, the key factor – the amount of adaptive genetic diversity – can usually not be measured directly. The use of proxies is currently unavoidable when aiming to assess the relevant genetic diversity on a large scale, including in countries with limited resources and in taxa that are difficult to study genetically. Over time, DNA-based approaches will become more widely available and may someday replace proxies.
More information: Hoban et al. 2024
Some species contain many populations connected by limited gene flow, which cannot each reach Ne>500. How should we deal with them?
This question was addressed in our webinar in December 2025:
Is DNA data always better than proxy data?
No – DNA data can sometimes be misleading or insufficient. If the individuals sampled for sequencing are not representative (e.g. because they are closely related), if the study does not sample enough individuals, or if the study does not consider population structure, Ne estimates may be incorrect. In addition, the signal in the DNA often ‘lags’ behind disturbance events and population size decline, so that an estimate of Ne based on DNA data may not fully reflect the rate of loss of genetic diversity. In such cases, non-DNA data provide an important complement.
More information: Gargiulo et al. 2024
What should I tell my scientist colleagues who say the indicators are oversimplified?
This question was addressed in our webinar in December 2025:
What happens if at some point the threshold of Ne 500 is not considered “correct” anymore?
The threshold is based on extensive research (dozens of studies, decades of research development) and is unlikely to be modified in the near future. Nevertheless, it is important to keep in mind that using thresholds is one way of keeping indicators simple and easily applicable – when working with individual species, it is always recommended to consider the underlying Ne estimates, and to ensure that these data are stored in the long term (as is done with the Red List – the Red List status is reported but the population size decline, Area of Occupancy and other data are stored as well).
More information: Willi et al. 2022
General practical issues
How long does it take to calculate the indicators?
Countries will currently mostly assess populations based on non-DNA (proxy) data. Therefore, the main time investment is for gathering information on census sizes and population numbers, e.g. from occurrence records. These time requirements vary among species and data sources; for some species, the process can be challenging. In pilot tests, 3–5 people (see next question for personnel qualifications) analysed 100 species in 3–4 full-time weeks, and one person required 3–4 months for 100 species. This assumes that data has already been collected for these species, such as through previous biodiversity monitoring, management reports, citizen observations, or consulting local experts and knowledge holders.
More information: Hoban et al. 2023
Are special skills or tools required for indicator calculation?
Some training in ecology and population genetics is necessary to work with the data used for indicator calculation. However, extensive experience in these fields is not required – for example, indicator calculation has already been performed successfully by undergraduate biology students and researchers with no background in genetics (e.g. ecologists). For some taxa, it will also be necessary to consult species experts regarding population delineation or population sizes. No specific tools are needed, but we recommend using the kobo data collection form, which ensures that all necessary information is gathered in a standardised format.
More information: Hoban et al. 2023
How do I convince the experts we need to consult for the genetic indicator work to spend their time on this?
This question was addressed in our webinar in December 2025:
Are there examples of countries that have already implemented the indicators?
This question was addressed in our webinar in December 2025. See also Mastretta-Yanes et al. 2024.
Species selection
Is it a problem that our species list is very biased towards some groups?
This question was addressed in our webinar in December 2025:
Are the indicators even meaningful if there are biases in the species list? How can they be comparable between countries?
This question was addressed in our webinar in December 2025:
Is it necessary to calculate the indicators for all species within a taxonomic group to be unbiased?
This question was addressed in our webinar in December 2025. See also Hebert et al 2025.
How do we deal with species that are hunted and managed for hunting?
These species can be included in the report and should not be treated any differently from other species (just like such species are included in the Red List Index and other indicators).
Which species are particularly good to use as indicators for a whole ecosystem?
While genetic diversity loss (e.g. due to habitat fragmentation) might be correlated between different species in the same ecosystem, it is usually not possible to choose species that represent the genetic state of a whole ecosystem: This would require a lot of background knowledge, and genetic diversity strongly depends on species biology. It does make sense to include ecological keystone species in the species list because they might be a conservation priority.
More information: Hvilsom et al. 2022
What should we do for species where we cannot reliably identify individuals?
This question was addressed in our webinar in December 2025:
Should we submit the CBD report even though we can assess only 20 species?
This question was addressed in our webinar in December 2025:
Should we include species that are at their distribution edge in our country?
Yes, such species are certainly interesting to include (as such species are also included in National Red Lists, federal endangered species laws, etc). Populations at the distribution edge might be genetically distinct and potentially vulnerable, and it is important to monitor them, especially under climate change.
What if our species list changes between different CBD reports?
It will be common that countries add more species to the list over time – which is positive. When comparing indicator values between years, they can just be calculated using the set of species that overlaps between years. In addition, it is important to note that historic data can be used to calculate the indicator retroactively, e.g. as noted in the CBD metadata document, “it is anticipated that biodiversity monitoring capacity within countries will increase over time, and thus countries may wish to increase the number of species included in their indicator calculation, e.g. from 100 to 1,000 species. In such cases, the species being newly evaluated can have retrospective indicator calculations made, assuming historic data is available. This highlights a broader opportunity, that such retrospective evaluation could extend indicator calculation into the past.”
Additional questions about species selection are addressed in a previous blog post.
Data gathering and storage
Do we need DNA data to calculate the genetic indicators?
No, the Ne 500 (A.4) and Populations Maintained (A.CY.22) indicators do not require DNA (sequencing or genotyping) data. Existing information about census population sizes (Nc) – e.g. from surveys, citizen science, camera traps etc. – can be used as proxy data because Ne is typically about 1/10th of Nc. Similarly, the number of populations maintained can be assessed using such data. However, if DNA data are available, they can be used to estimate Ne. It is especially valuable to compare the Ne estimates obtained from census size data with those obtained from DNA data.
More information: Hoban et al. 2023
Is it necessary to collect new data to calculate the indicators?
No, at least not immediately. For many countries, information on population sizes already exists for many species, for example from monitoring projects, scientific studies, and citizen science observations. These are often available in large databases that can be used to identify populations and estimate Ne (see e.g. here for an example from Belgium). In the longer term, it does make sense to invest in (DNA or non-DNA) monitoring, especially for important or threatened taxa and those currently systematically underrepresented.
More information: Coalition for Conservation Genetics guideline materials
How do we find the data required for indicator calculation?
For most species, DNA data will not be available. It therefore makes sense to estimate census population sizes (Nc) and calculate Ne via the Ne/Nc ratio. Species occurrence records or population size assessments can e.g. be found in national or international databases, management reports, or scientific studies. For some species, Ne estimates based on DNA data might already be available in the scientific literature.
More information: Coalition for Conservation Genetics guideline materials
Is there enough census or geographic data?
For many species, yes. Many countries have biodiversity databases that contain the relevant information, occurrence records from databases such as GBIF can be used, and the Red List assessments also often contain the necessary information. Several countries have already successfully assessed genetic diversity based on such databases in dozens of species. Because occurrence records in databases are often biased or incomplete, it is nevertheless important to get in touch with local species experts when needed.
More information: Hoban et al. 2023, Mastretta-Yanes et al. 2024
Can we use data from other reports to calculate the indicators?
Yes, absolutely. For example, Red List records as well as within-country species management and recovery plans can be very informative and have been used extensively for genetic indicator assessments in some countries.
How should we handle cross-border populations?
This question was addressed in our webinar in December 2025:
How do we sample DNA in a non-invasive way?
This depends on the species you work with, so the best approach is to collaborate with a geneticist in your country to design sampling/monitoring that suits your needs.
How and where are the data stored?
The storage of the data underlying the CBD reports needs to be organised within each country. The kobo data collection form can be used to gather the data; the resulting spreadsheet contains both the estimates and the methods used for each population in a standardised format. This information is highly valuable both when identifying populations for management and for ensuring that the indicators are assessed in a comparable way in different reporting periods.
What happens if we use scientific data that the scientists are not happy to publicly share?
This should usually not be a problem. The CBD report will only contain the indicator values, and it is not necessary to publish the underlying (DNA or non-DNA) data. Strictly speaking, the CBD report even only requires a single indicator value reflecting all species, so that no information about individual species needs to be published. We do recommend publishing the more informative disaggregated (per-species) indicator values where possible, but these still do not contain details about individual populations.
Population delineation
Why do we need to define populations?
Species are usually subdivided into natural populations (due to discontinuous habitats, seasonality, etc.), each of which might possess distinctive traits and adaptations. Considering populations is essential to conserve genetic diversity within species. Both the Ne 500 indicator (A.4) and the Populations Maintained indicator (A.CY.22) are proportions of populations with certain characteristics – therefore, population delineation is a crucial step that needs to be performed before indicator calculation.
More information: Coalition for Conservation Genetics guideline materials
How can we define populations in the best way?
“A ‘population’ is a group of individual organisms that can mate with each other and has low or no connectivity with other populations.” To define a population, different data types can be used.
- Genetic or genomic data can help define populations by identifying distinct genetic clusters. However, a genetic/genomic approach is often not the cheapest and most feasible option and requires extensive research knowledge, sampling and dedicated infrastructure (e.g., laboratory space, servers for data storage and processing).
- Information on geography and ecology of the species is often key to defining populations. Such data can provide insights into local adaptations. Local adaptation is the process by which populations have specific traits that lead to a higher survival and reproduction rate in the local environment than elsewhere.
- Dispersal information reflects how far individuals or their offspring can move and can therefore indicate whether certain localities can be grouped together as a single population or rather should be considered as separate populations.
- Local or traditional knowledge is an important data source. Indigenous people and local communities often possess valuable information about species occurrences, their abundances or even specific populations.
Those different data types can act complementarily but can also be used alone. A population definition based on a combination of genetic, ecological, spatial, and geographic information would be one of the best approaches.
Reporting on genetic diversity indicators to the CBD is at the country level (though indicators can be used at larger and smaller scales). If species occur across country borders, e.g. as large continuous populations, defining discrete populations can be challenging. This case necessitates transboundary work and communication.
More information: Coalition for Conservation Genetics guideline materials
How can we define populations in a realistic way without genetic data?
This question was addressed in our webinar in December 2025. See also: Coalition for Conservation Genetics guideline materials
What happens if we don’t have enough data to define populations?
Don’t get discouraged! Assess numerous and diverse sources to derive information (Information on how many populations are present or remain might be available in management plans, monitoring reports, databases managed by NGOs, etc.). And contact species experts – there might be unpublished data or information in small journals that is difficult to find online. You can also consider implementing a small study to acquire at least one of the necessary data/information types. If it’s impossible to assess a species, of course it can just be excluded from the CBD report.
What do we do if different experts have different opinions regarding population delimitation?
If there are different opinions about population boundaries or number of populations, the indicator can be calculated multiple times (see How to account for uncertainty in the indicator guidelines) and an upper bound, lower bound, and an average can be calculated.
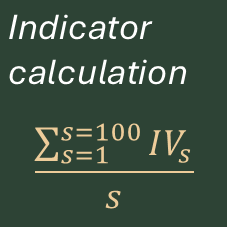
Indicator calculation
How exactly do we calculate the indicators?
Both the Ne 500 indicator (A.4) and the Populations Maintained indicator (A.CY.22) are simple fractions. For the Ne 500 indicator for a single species, you need to first estimate Ne for each population – the indicator for a species is the count of populations with Ne>500 divided by the total number of populations. The indicator at the country level is an average across species. You can find the equations and example calculations here.
More information: Background section
How do we estimate Ne from non-DNA data?
If you have an estimate of the census population size (Nc, the number of mature individuals) for a population, you can estimate Ne via the standard Ne/Nc ratio of 0.1. In case there is a species-specific Ne/Nc ratio, use that one instead. If you don’t have an estimate of Nc but know the area occupied by the population (e.g., from occurrence records) and the species’ typical density, you can first estimate Nc using these data and then apply the Ne/Nc ratio. Or you can consult experts and local knowledge holders to ask questions such as “are there many hundreds, thousands, or just a few individuals?”.
More information: Coalition for Conservation Genetics guideline materials
How should we obtain Ne when we only know the area occupied by a population?
This question was addressed in our webinar in December 2025:
How can we find species-specific Ne/Nc ratios?
These can often be found in the scientific literature; a compilation can be found in this study (Supplementary Information) and a graphical representation is in this paper (Fig. 4).
More information: Coalition for Conservation Genetics guideline materials, Hoban et al. 2024
How can we calculate Ne from DNA data?
There are different methods that estimate Ne from a range of signals in genetic/genomic data – e.g. from allele frequency changes over time, the relatedness between different individuals, or linkage disequilibria (associations between different genes). These methods are listed here and discussed here. Based on the ease of implementation and robustness (e.g. number and type of markers, single sample), we currently usually recommend the Linkage Disequilibrium method (software LDNe) and the Sibship Frequency method (software Colony) when sampling was performed at a single point in time. The Temporal method is useful if temporally separated samples are available.
Comparing and/or combining results from a few methods can greatly help interpret Ne estimates in the context of species range and migration rates between populations in a metapopulation context.
GINAMO is working on more detailed recommendations and workflows for using DNA data.
More information: Coalition for Conservation Genetics guideline materials, Waples 2016, Ryman et al. 2019, Waples 2023 (specifically on the LD method)
Should we use the same type of DNA marker for every species? How much data do we need?
The Linkage Disequilibrium (software LDNe) and Sibship Frequency (software Colony) methods both work for different marker types. It is not necessary to use the same markers and methods for all species – e.g., it is fine to use microsatellite data for some and whole-genome sequencing for other species – but comparing and reporting them greatly helps to interpret the resulting Ne estimates (see previous question).
For SSR data, we recommend at least 10 markers, since there is evidence that estimation becomes unreliable with lower numbers. For SNP data, a range of 1000-3000 independent loci has been recommended, and has been confirmed based on our experience with species with a wide range of life-history traits and diversity levels.
Regarding the number of individuals, for the LDNe method, we recommend a minimum of 20 individuals per population. However, the larger the true Ne, the more bias is expected. For the Sibship Frequency method, larger sample sizes (at minimum ~30 individuals) are recommended for accurate estimates, although higher accuracy will be attained with more samples, especially for Ne above 1000 individuals.
More information: Waples 2023, Wang 2023
How do we deal with the uncertainty when census population sizes are unknown or the range includes 5,000 individuals?
This question was addressed in our webinar in December 2025:
How can we deal with species that show large year-to-year changes in Ne?
This question was addressed in our webinar in December 2025:
Can we include uncertainty regarding the Ne/Nc ratio when calculating the Ne 500 indicator?
Yes. It is possible to calculate the indicator multiple times (e.g. with Ne/Nc ratios of 0.1, 0.2, and 0.3). Often, the resulting indicator value will be the same anyway, given that it is threshold-based. If indicator results vary, this variation can be included in the species-level report. For the indicator value aggregated across species, an upper bound of the indicator can be derived with the most optimistic assumption (e.g. Ne/Nc = 0.3) and a lower bound derived with the more conservative assumption, and both can be reported, or an average can be reported.
Is it okay that our Ne 500 indicator is based on occurrence records collected over more than 10 years?
This question was addressed in our webinar in December 2025:
How do we combine species to calculate the per-country indicator value?
This question was addressed in our webinar in December 2025. See also: Coalition for Conservation Genetics guideline materials
What should we do if populations have recently fragmented or merged?
This question was addressed in our webinar in December 2025:
How do we keep track of the assumptions underlying indicator calculation for each species?
This question was addressed in our webinar in December 2025:
More information
If you couldn’t find an answer to your question, feel free to post it in this Google Group or reach out to us via email (ginamo[@]nord.no)!
Further resources:
- The official guidance document from the CBD
- Genetic indicator guideline materials and the associated paper
