
One of GINAMO’s main goals is to develop science-based guidance and tools for applying the Convention on Biological Diversity genetic diversity indicators in practice. This March, GINAMO celebrated its second anniversary, and so it’s time for an update on our progress!
The “challenges” GINAMO is addressing come from different sources. Some were clear from the start. For example, the Ne500 indicator measures whether populations have an effective population size (Ne) greater than 500 and are therefore large enough to maintain genetic diversity. To calculate this indicator, one of course needs to determine Ne – but this is not always straightforward. So, we knew we would work on identifying the best approaches to estimate Ne. But we also organised workshops in the five countries we primarily focus on – Belgium, France, Italy, Norway, and Sweden – asking stakeholders tasked with indicator reporting about the challenges they face. These challenges were then categorised and analysed by our social scientist (more on their work later on). In total, we collected 85 challenges and questions, ranging from how to avoid overrepresenting certain species groups to how to store the data underlying the reports. So far, we have been working on about 42 of these!
Click on the type of challenge you’d like to read more about:
Challenges we have addressed using existing knowledge
Some stakeholder questions could be addressed just by sharing information we gathered from previous research or our experience with indicator calculation. For example, we already have clear recommendations on data sources to use for calculating indicators. You can find these challenges and our answers in the FAQ on this blog, our blog text on species selection, our text about the practical example in Belgium, and our webinar “Genetic indicators in practice” in December 2025. Many practical questions are also targeted in the genetic indicator guidelines by the Coalition for Conservation Genetics.
In addition, some GINAMO scientists have been directly part of national teams tasked with indicator calculation, or have supported them individually with information and troubleshooting.
Solutions that can be co-created
A core part of GINAMO’s work involves co-creation: defining what the problem is and generating solutions together with stakeholders, through direct exchanges. Solutions are more likely to be adopted when they address challenges that stakeholders themselves have identified. This ensures the solutions proposed are rooted in practice, not just theory. At the same time, contexts differ: across countries, institutions, and existing knowledge bases. By arranging workshops in five different countries we were able to capture some of those differences but also the similarities. You can read about the outcomes in our five country reports (Belgium, France, Italy, Norway, Sweden). Co-creation requires significant time and resources from all involved. We have chosen to engage in co-creation for two challenges where we believe that the combined knowledge of GINAMO and country stakeholders will be the most rewarding and useful:
A method for species selection
One of the challenges with calculating national indicators is the selection of species to include – and this one is crucial, as it is the first step. We have already written some initial guidance on species selection, but a well-defined process that captures the criteria forming the basis of species selection is the goal in the long run. Our colleagues at Syke in Finland have developed a method for selecting a balanced, representative set of species, based on criteria defined by national stakeholders. In a series of workshops this spring and summer, we will guide invited stakeholders from our five pilot countries in using this method and generating their own species list, and we will use their input to make the method better suited to stakeholder needs. For countries that have not decided on a strategy yet or that want to revise the list they used for the first report, this method will provide an option to make their work easier.
A workflow for streamlined genetic indicator calculation
At the moment, researchers and stakeholders calculating the Ne500 indicator from DNA data need to set up their own workflows for cleaning and exploring the data and calculating Ne. A standardised workflow that runs the different steps automatically will reduce workload and make the results more comparable between species. In GINAMO, we are developing such a workflow, implemented in Galaxy (a web platform for collaborative, reproducible data analysis). The user can upload a file containing the genetic data (genotyping matrix), and the pipeline will produce a report including the Ne estimates. This pipeline is meant to be used by stakeholders. This is where co-creation comes into play: in workshops this summer, stakeholders will have the chance to try out this tool and give feedback, so that we can make it as broadly useful and user-friendly as possible.
Challenges that require more research
There are several scientific challenges that GINAMO is currently tackling. Here are some with direct relevance for stakeholders doing indicator work:
How can we best estimate genetic indicators from DNA data? Using simulations to find out
Ne is a complex concept, and it can be estimated in surprisingly many ways. In GINAMO, we are trying to figure out which method comes closest to the “true” Ne. We cannot compare how well different methods work in real data from natural populations, because for those populations we do not know the “true” Ne (it is exactly what we want to estimate!). So, we are using computer simulations instead. These simulations mimic different actual species, but we can set values for fecundity rates (e.g. the number of eggs produced), population sizes, gene flow between populations, and other factors. In these simulated populations, we can know the true Ne – we can derive it because we control all the different factors that affect Ne. We can then (virtually, using the simulated data) compare different sampling strategies – e.g., vary the number of individuals and genetic markers we analyse – and different methods for estimating Ne. The methods that produce values closest to the true Ne are the most reliable and can be recommended to stakeholders to use on real data.

We use the European beech as a model system to understand how to determine Ne in species with large, continuous populations.
One particular challenge when working with Ne occurs with species that do not have clearly defined populations. For example, tree species can cover very large areas without forming separate populations, with genetic and phenotypic characteristics changing gradually in space; and fish can be continuously distributed in rivers. In such cases, calculating Ne (and even knowing what Ne actually describes) is difficult. We are addressing this challenge using the European beech and sticklebacks as examples, again trying to find the most reliable ways of estimating Ne. Eventually, this will lead to guidelines for how to deal with such species.
We also organised a workshop on how to estimate and use Ne in Trondheim last year – you can see the recorded talks here.
How can we best estimate genetic indicators from non-DNA data? Using birds to find out
Ne can also be estimated, and the Ne500 indicator calculated, when DNA data isn’t available. Counts of mature individuals per population (Nc) can be “translated” into Ne: Ne is often roughly 10% of Nc (i.e. Ne/Nc ratio = 0.1). However, there is variability between species in this ratio. To account for this, we conducted a first genetic indicator project at a continental scale (EU-level), where we calculated the Ne500 indicator using three representative ratios: 0.1, 0.2, and 0.4. This approach was applied to 187 bird species listed in Annex I of the EU Birds Directive. This continent-level perspective on Ne is crucial especially in species with large dispersal distances or migration behaviour. At the same time, the project developed best practices for indicator calculation using open-source, non-DNA data. The findings will be incorporated into a scientific paper, which will include a structured workflow.
How can we best estimate genetic indicators from space? Using Earth Observation data to find out
Maybe we can even estimate genetic diversity from space? That is what we are exploring with Earth Observation data (which measures vegetation, land cover, and other environmental features using satellites). Satellite data can show how large the habitat of a species is, and how well different habitat patches are connected. Together, this information reflects population sizes and genetic diversity.
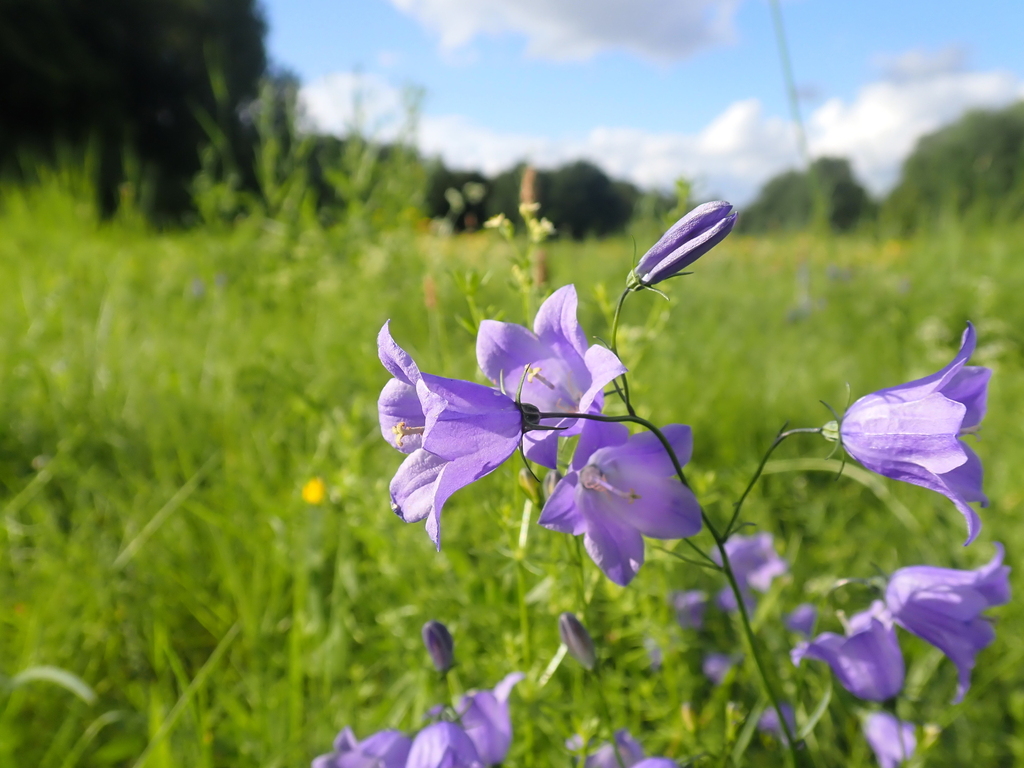
The harebell helps us understand how Satellite Earth Observation data can be used to estimate genetic diversity.
Using these data with new analyses approaches, it may be possible to determine whether Ne is large enough (i.e. above the 500 threshold) without collecting samples or direct observation of individuals in the field. We use the harebell (Campanula rotundifolia) as a test case, taking advantage of extensive genetic data available for validation. We have discussed our approach in two workshops with stakeholders in Sweden, and are producing a tool that largely automates the use of satellite data.
Challenges the countries need to solve on their own
We are here to support stakeholders with some of the challenges they face – but unfortunately not with everything! For example, our scientific expertise is not very useful for solving administrative challenges (such as who is responsible for which task with indicator reporting, how to obtain funding, and where to store the data?). These issues must be addressed on a country-specific basis. However, we provide opportunities to hear from other countries how they have addressed these challenges. For example, in a recent blog post we reported about the situation in Belgium, and similar posts will discuss the experiences in other countries soon. Our species selection workshop and a second country-specific meeting towards the end of GINAMO, later this year, will provide additional opportunities for exchange between stakeholders in different countries.
As always, if you have any questions or suggestions, do not hesitate to get in touch with us! Ginamo[@]nord.no
